Cryptocurrency trading is characterized by rapid fluctuations and occasional bull runs amid market dips, making it a fertile ground for trading opportunities. Experienced traders in the crypto space rely on technical indicators such as Bollinger Bands (BB), moving averages and RSI to effectively interpret market trends.
What are Bollinger Bands (BB)?
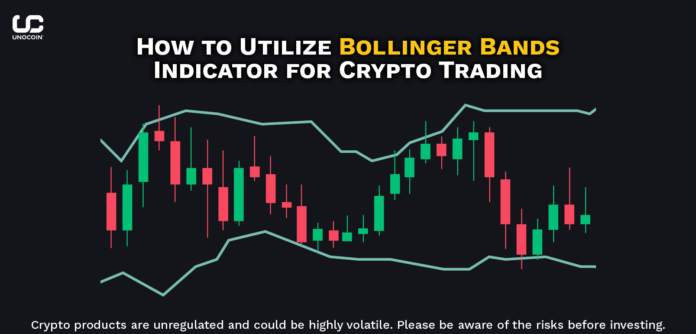
Developed by John Bollinger in the 1980s, Bollinger Bands are a popular technical analysis tool. They assess price volatility, identify potential reversal points and determine entry and exit signals for trades.
The BB indicator contains three bands:
Mid Band: Represents the simple moving average (SMA) of the asset’s price over a certain period (typically 20 days), indicating the direction of the trend.
Upper Band: Calculated by adding two standard deviations to the median band, it represents the upper price range of the asset and acts as resistance.
Lower band: Calculated by subtracting two standard deviations from the middle band, indicates the lower price range (support level) of the asset.
Using Bollinger Bands When Trading Cryptocurrencies:
BB indicators are key in identifying entry and exit points across a variety of trading strategies, from swing trading to long-term investments:
Entry points: Traders interpret touching or breaking the lower band as a signal of oversold conditions, indicating a buying opportunity due to a potential price bounce.
Exit points: Conversely, when the price approaches or breaks above the upper band, it indicates overbought conditions, prompting traders to consider selling for profit-taking opportunities.
Improving trading strategies using Bollinger Bands
Volatility and price range identification: Analyze the distance between the upper and lower bands to gauge expected price fluctuations. Wider bands mean increased volatility, while narrower bands mean lower volatility.
Observing overbought and oversold conditions: BB helps identify extremes in the market: touching the upper band signals potential overbought, while touching the lower band indicates a potential oversold condition.
Trading Strategy: Bollinger Bounce and Bollinger Squeeze
Bollinger Bounce: Buy when the price bounces off the lower band and sell when it bounces off the upper band.
Bollinger Squeeze: Identify periods of low volatility (narrowing bands) to predict breakout patterns.
Combining Bollinger Bands with other indicators: To verify signals, combine BB with tools like RSI for trend reversal and volume analysis to confirm price action.
Limitation of Bollinger Bands: Despite their usefulness, Bollinger Bands have limitations
- Whipsaw Effect: BB can generate false signals during high volatility or sideways markets.
- Not Standalone: Should be used in conjunction with other indicators.
- Normal distribution assumption: This may not apply during periods of extreme volatility.
- Lag Indicator: Relies on historical data and potentially delays timely signals.
Conclusion: While Bollinger Bands provide valuable insights for cryptocurrency trading strategies, prudent traders use them in conjunction with other indicators and use risk management techniques to effectively navigate market risks.
This release is tailored to highlight the practical application of Bollinger Bands in cryptocurrency trading, in line with Unocoin’s focus on providing informative and actionable content for traders.
Please find the list of authentic Unocoin accounts for all your queries below:
- Twitter: https://twitter.com/Unocoin
- Instagram: https://www.instagram.com/unocoin/
- Facebook: https://www.facebook.com/unocoin/
- LinkedIn: https://in.linkedin.com/company/unocoin
- YouTube Channel: https://www.youtube.com/c/Unocoin/videos
- Newsletter: https://medium.com/subscribe/@Unocoin_growth
- Blogs: https://blog.unocoin.com
- Telegram Group: https://t.me/Unocoin_Group
- Telegram Channel: https://t.me/+fasQhTKBsfA5N2Zl
- Telegram: https://t.me/UnocoinSupport_Bot
- E-mail id: [email protected]
- Contact details: 7788978910 (09:30 AM IST – 06:30 PM, Mon-Sat)
- App store link: https://apps.apple.com/us/app/unocoin/id1030422972?ls=1
- Playstore link: https://play.google.com/store/apps/details?id=com.unocoin.unocoinwallet
Disclaimer: Crypto products are unregulated as of this date in India. They could be highly volatile. At Unocoin, we understand that there is a need to protect consumer interests as this form of trading and investment has risks that consumers may not be aware of. To ensure that consumers who deal in crypto products are not misled, they are advised to DYOR (Do Your Own Research).


