Terms for beginners to start trading crypto
If you are into the crypto space, you must have heard of *Do Your Own Research, *Don’t Trust, Verify. While the crypto market has become a lucrative way of making money, it carries its share of risks. And because of the many risks involved, many beginners often lose money instead of making it. Though we are not certified financial experts, as a crypto exchange, we want to provide the best knowledge available to our family of Unocoiners.
This blog is essential to traders who trade for short terms, rather than holding assets for a long time. This blog also aims to explain technical terms and concepts used in the financial market that are also applied in the crypto market. Understanding these terminologies and ideas can help one make an informed financial decision. While we want to explain more in detail, this information is only recommended to beginners. So if you are already at the advanced stage of your financial journey, you may want to skip to our other blogs. We also want to mention that we will come up with better educational materials in the future, and we request you to comment below if you wish to read more of this type of content.
For now, let’s start with lessons.
1. Understanding Price Trends
Identifying the market trend is the first step any traders and investors would take. Before making any trade, you need to determine what market you want to trade. Do you want to trade in the bull market or the bear market? Whether you trade on either of the markets depends on you. Here are two things you need to know about market trends.
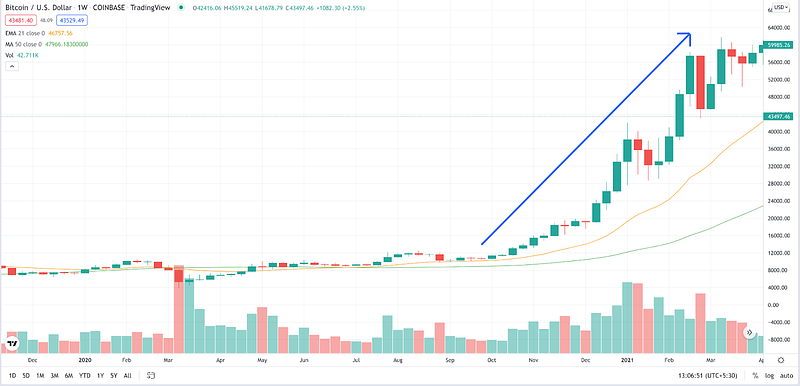
Identifying Uptrend
An uptrend is a price movement of a financial asset when the direction is upward in a given period. The uptrend would usually have successive higher peaks and troughs. In a simple understanding, an uptrend is usually when the demand is more than the supply of an asset. When the demand exceeds the supply, it drives the price up, and we are said to be in a bull market. As long as the demand for an asset exceeds the supply, the trend is upward. In other words, an uptrend is when there are more buyers than sellers.
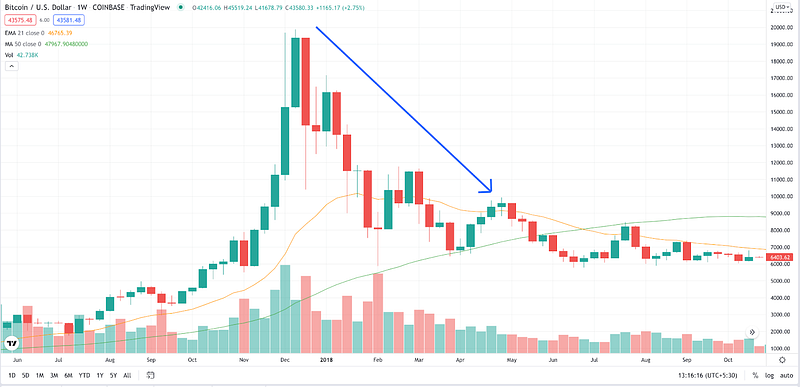
Identifying Downtrend
A downward trend is opposite to an uptrend. It describes the price movement of a financial asset when the direction is downward for a given period. The downtrend makes successive lower peaks and troughs. Downtrend happens when the supply exceeds the demand. When there are more sellers than buyers in the market, it drives the price down, and the market is said to be in a bear market. As long as the supply for an asset is more than the demand, the trend is downward. In other words, a downtrend is when there are more sellers than buyers.
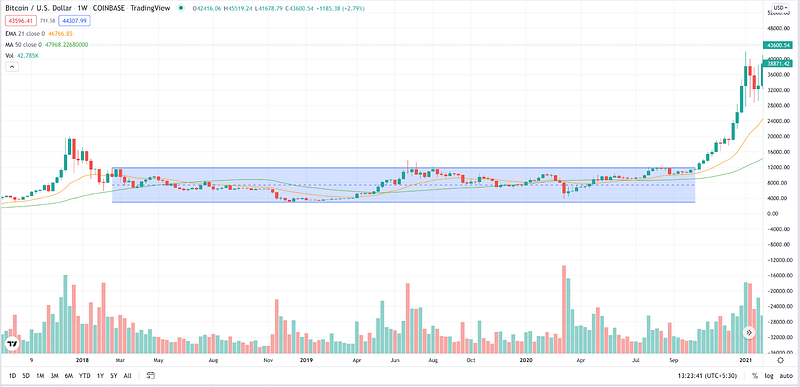
There is also another additional market trend known as sideways. It describes the price movement of an asset when the direction goes in the same price range over a defined period. The price failed to break the resistances in the sideways market and maintained its support.
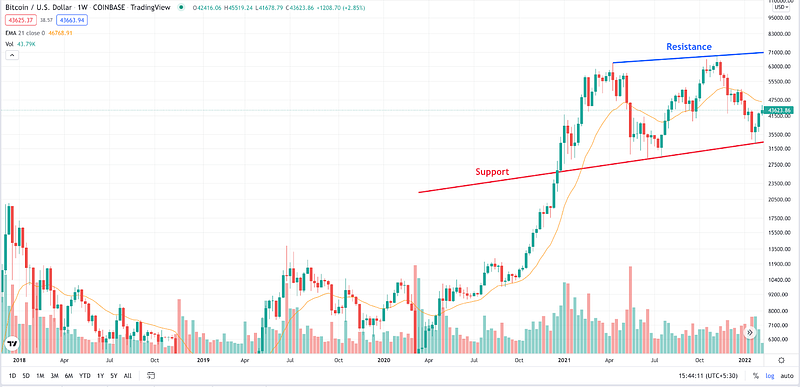
2. Understanding Support and Resistance
Support and resistance bands are two essential concepts traders need to understand. Support is a price level where bulls make a strong demand and prevent the assets from falling further down. In other words, at a support level, buyers overcome sellers and push the price up. If the support band has broken, it is said that the bears have won over bulls. One can draw the support line from the candle’s wick or body.
On the other hand, resistance is a price level where supply exceeds demand. As bears give high resistance for bulls to push the price up, it is called resistance. At the resistance level, sellers overcome buyers and push the price down. If the resistance level is successfully overcome, it is said that the bulls have overcome the bears.
Here is a good trading strategy tip for you. When the resistance line is successfully penetrated, that line becomes a new support line. Similarly, when the support line is broken, it becomes the resistance line for the next trend. Experience traders find patterns and forecast trends using support and resistance bands.
3. Understanding candlestick
Among all the charting and graph types that represent the price movement of a financial asset, the candlestick chart is one of the most accurate and popular ones. Primarily candlestick charts provide lots of information in a minimalistic way. First developed and used by Japanese rice traders in the 1700s, candlestick visualises the demand and supply of an asset in the market. A single candlestick is not enough to understand the market flow; instead, a group of candlesticks forming patterns give the picture to analyse the market.
Before understanding the details and how to use candle charts in trading, let’s learn the different components of a candlestick.
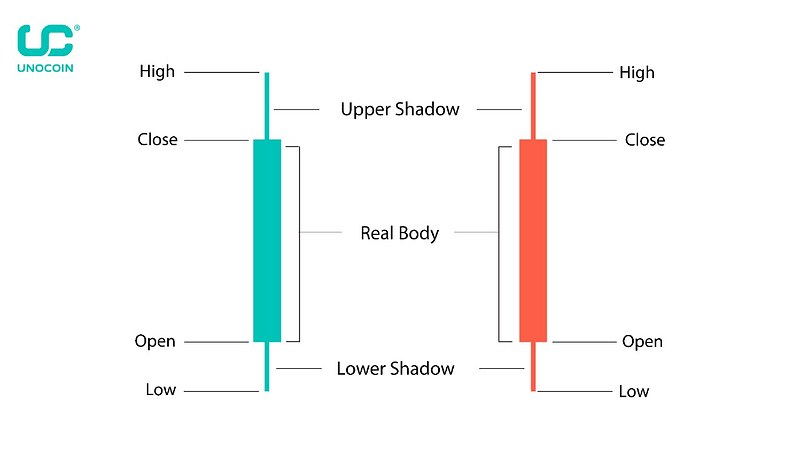
There are two different types of candlesticks in a broad category: a bullish candlestick and a bearish candlestick.
Bullish candle
A bullish candlestick is usually represented by a green or a blue candle. Four attributes give four different information in the bullish candlestick.
- High- The low is the highest part of the candle; a wick or shadow represents it. It is the highest price an asset goes in a given period.
- Close- Close is the top of the body of the bullish candlestick. It represents the closing price of an asset in a given period.
- Open- Open is the bottom of the actual body of the bullish candlestick. It represents the opening price of an asset in a given period.
- Low- The low is the lowest part of the candle; a wick or shadow represents it. The bass is the lowest price an asset goes in a given period.
Bearish candle
A bearish candlestick is usually represented by a red or a black candle. Four attributes give four different information in the bullish candlestick.
- High- The low is the highest part of the candle; a wick or shadow represents it. It is the highest price an asset goes in a given period.
- Open- Open is the top of the actual body of the bearish candlestick. It represents the opening price of an asset in a given period.
- Close- Close is the bottom of the actual body of the bearish candlestick. It represents the closing price of an asset in a given period.
- Low- The low is the lowest part of the candle. It is represented by a wick or a shadow of the candle. The bass is the lowest price an asset goes in a given period.
Remember, the opening price in the bullish candlestick is at the bottom of the body while it is at the top of the bearish candlestick’s. Similarly, the closing price in the bullish candlestick is at the top of the body while it is all
the bottom of the body in the bearish candlestick.
Though the bullish and the bearish candlesticks are popularly the main types of candlestick, there are also other different candlesticks to look into. While it is beyond the scope of this blog to cover all of them, here are the four more essential candlesticks to look at.
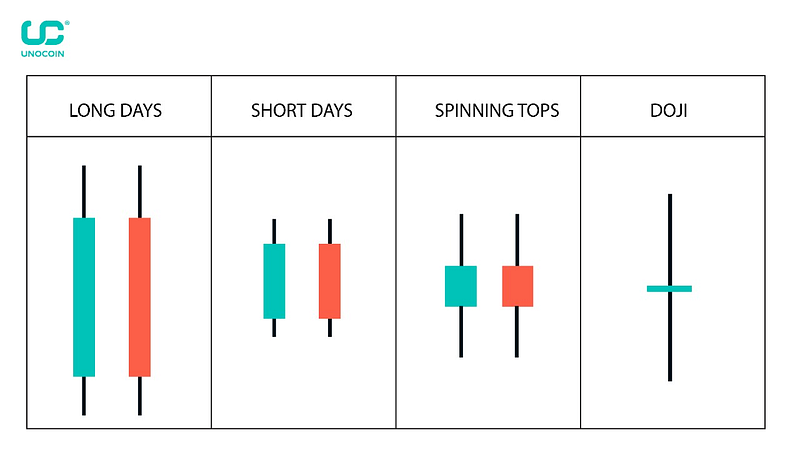
- Long Day Candle — Long day candles are formed when there is a high price movement in a given period. In other words, there is either a high price rise or fall of the asset in the given period.
- Short Day Candle — Short day candles are formed when there is a quick price movement in the given period. In other words, there is either a sharp price rise or fall of the asset in the given period.
- Spinning tops candle — This type of candlestick is formed when there is indecision in the market. In other words, the buyers push the price up, and the sellers push the cost down and meet in the middle. In this type of candlestick, the short body is precisely in the middle of the lower and higher shadow/wick of a candlestick. This type of candlestick gives an unpredictable future event to the traders.
- Doji Candle — Doji candlesticks are similar to spinning tops candles. In the case of doji, there is little or no difference between the open and close price of an asset in the given period. It can be either a long upper or lower shadow or both. Like spinning tops candlestick, doji provides indecision moments for traders, and the market may reverse in any direction.
Thank you for reading this. We hope you learnt something new today. In the coming weeks, we will share more educational content on different trading indicators that can be used for your trading strategy. In the meantime, if you are looking to buy your first crypto, Unocoin is offering a welcome bonus of 100 INR worth of bitcoin. Feel free to check it out.
About Unocoin
Unocoin is India’s first and the most secure bitcoin trading app. This exchange app was founded in 2013. You can buy and sell bitcoin instantly using the Instant Buy and Sell feature. Not just this, you can also buy ETH and Sell ETH in no time. With more than eighty-seven coins listed on this best cryptocurrency exchange in India, you can also accept bitcoin from your friends from any location. You can also know which cryptocurrency works best for you with the price ticker and notifications. The most popular cryptocurrencies like Bitcoin (BTC), Ether (ETH), USDT (Tether), BNB, Ripple (XRP), Cardano (ADA), Solana (SOL), Binance USD (BUSD), Dogecoin (DOGE), Polkadot (DOT) and other popular altcoins can be traded on the go. The new Android and iOS applications make Unocoin the best cryptocurrency app. With the unique feature of the Systematic Buying Plan, you can buy and sell bitcoin and Ether periodically. What more? You can start your crypto journey using SBP for as little as INR 10. With another exciting feature called Crypto Basket, you can diversify your crypto portfolio based on market capitalisation (Market Cap) or Volume. These two excellent features make Unocoin the best cryptocurrency platform.
Love Crypto Coins. Love Unocoin.
Please find the list of authentic Unocoin accounts for all your queries below:
- YouTube Channel: https://www.youtube.com/c/Unocoin/videos
- Newsletter: https://medium.com/subscribe/@Unocoin_growth
- Blogs: https://blog.unocoin.com
- Instagram: https://www.instagram.com/unocoin/
- Twitter: https://twitter.com/Unocoin
- Facebook: https://www.facebook.com/unocoin/
- LinkedIn: https://in.linkedin.com/company/unocoin
- Telegram Group: https://t.me/Unocoin_Group
- Telegram Channel: https://t.me/+fasQhTKBsfA5N2Zl
- Telegram: https://t.me/UnocoinSupport_Bot
- E-mail id: [email protected]
- Contact details: 7788978910 (09:30 AM IST — 06:30 PM, Mon — Sat)
- App store link: https://apps.apple.com/us/app/unocoin/id1030422972?ls=1
- Playstore link: https://play.google.com/store/apps/details?id=com.unocoin.unocoinwallet
Disclaimer:
Crypto products are unregulated as of this date in India. They could be highly volatile. At Unocoin, we understand that there is a need to protect consumer interests as this form of trading and investment has risks that consumers may not be aware of. To ensure that consumers who deal in crypto products are not misled, they are advised to DYOR (Do Your Own Research).


