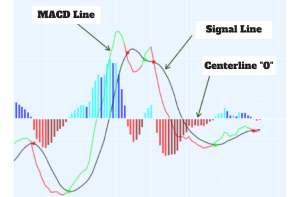
MACD- typically known as’ moving average convergence divergence’ is an indicator for momentum waveguide which helps in predicting the upcoming trends of the market.
When momentum begins to decline, it signals traders that the prices could begin to consolidate or reverse. Many traders also use the MACD histogram to predict MACD crossover signals.
MACD history
MACD was created by Gerald Appel in the late 1970s. It measures the momentum by making note of whether certain moving averages are converging or diverging. It is also considered one of the simplest and most effective momentum indicators available. MACD calculates momentum by subtracting the longer moving average from the shorter moving average.
Components
The key MACD points consist of the 12-day exponential moving average and the 26-day exponential moving average.
- The MACD line is created by subtracting the 12-day exponential moving average from the 26-day exponential moving average.
- The MACD signal line is a 9-day exponential moving average of the MACD line.
- The MACD histogram is the difference between the MACD line and the MACD signal line.
Transition signal strategy
Divergence occurs when 2-exponential moving averages move away from each other, while convergence occurs when moving averages move toward each other. A shorter moving average (12-day exponential moving average) is faster and accounts for most MACD movements. A longer moving average (26-day exponential moving average) is slower and less responsive to price changes.
When the MACD line crosses above the MACD signal line, positive momentum is accelerating. When the MACD line crosses below the MACD signal line, negative momentum is accelerating. You can use the crossover signal as a direct buy signal, but you can also incorporate this signal into other technical analysis tools.
MACD histogram
The MACD signal line can also be displayed in the form of a histogram. The MACD histogram oscillates around the zero index level. When the histogram crosses above the buy zero index line, a signal is generated. MACD-histogram represents the difference between the MACD and its 9-day EMA, a signal line. The histogram is positive when the MACD is above its 9-day EMA and negative when the MACD is below the 9-day EMA.
Trading MACD Divergence
MACD divergence occurs when prices are rising or falling at a slowing pace. This concept is important because of your need to want to follow the market trend when price changes accelerate. When prices start to slow, the market is moving into equilibrium and will likely consolidate until new information moves it again.
The way to measure MACD divergence is to look for a situation where prices are rising and the MACD trajectory is falling. It can also occur when prices are falling and the MACD trajectory is rising.
Examples of Divergence
If you look at the gold price chart, you can see that there was a MACD divergence in February 2019. Here, gold prices were rising, but the trajectory of the MACD line was falling. You can draw the MACD line trend line and determine the MACD line trend. You can also do this analysis using the MACD histogram. If the price of gold is rising but the MACD histogram is flat or falling, there is a divergence.
In these situations, prices are rising while momentum is falling, meaning prices are experiencing a shock. A good way to think of it is if you take your foot off the accelerator of your car when you’re going up a hill. Initially, you would continue higher, but as your speed slows, you will eventually reach a point where you could start falling back down.
Using the MACD histogram to predict a crossover
MACD-Histogram can help you predict the signal line crossing in MACD when divergences start to appear. These divergences signal that the MACD is converging on its signal line and could be ready to generate a crossover signal. There are two types of divergence, peak-valley and oblique. A peak-trough divergence is formed with two peaks or two troughs in the MACD histogram. A bullish divergence from the top-bottom is formed when the MACD makes a lower low and the MACD-Histogram makes a higher low. Well-defined troughs are important. Skewed Divergence I like the divergence you see when you draw a trend line over the MACD line.
Please find the list of authentic Unocoin accounts for all your queries below:
- YouTube Channel: https://www.youtube.com/c/Unocoin/videos
- Newsletter: https://medium.com/subscribe/@Unocoin_growth
- Blogs: https://blog.unocoin.com
- Instagram: https://www.instagram.com/unocoin/
- Twitter: https://twitter.com/Unocoin
- Facebook: https://www.facebook.com/unocoin/
- LinkedIn: https://in.linkedin.com/company/unocoin
- Telegram Group: https://t.me/Unocoin_Group
- Telegram Channel: https://t.me/+fasQhTKBsfA5N2Zl
- Telegram: https://t.me/UnocoinSupport_Bot
- E-mail id: [email protected]
- Contact details: 7788978910 (09:30 AM IST – 06:30 PM, Mon – Sat)
- App store link: https://apps.apple.com/us/app/unocoin/id1030422972?ls=1
- Playstore link: https://play.google.com/store/apps/details?id=com.unocoin.unocoinwallet
Disclaimer: Crypto products are unregulated as of this date in India. They could be highly volatile. At Unocoin, we understand that there is a need to protect consumer interests as this form of trading and investment has risks that consumers may not be aware of. To ensure that consumers who deal in crypto products are not misled, they are advised to DYOR (Do Your Own Research).


