
Understanding the key terms of crypto trading is a prerequisite in order to correctly read the market trends. “Support” and “resistance” are two such foundational concepts that are important to understand.
While these two words are often mentioned in the world of trading, novice traders mostly draw a blank as these terms are brought up. Taking note of it, we have made a guide for you to understand the support and resistance levels and help you make more insightful trading decisions.
What are Support and Resistance?
There are several trading strategies that include support and resistance levels. Pivot levels are most commonly used in the analysis for calculating support and resistance level.
When trading, it is advantageous to use common strategies, as these will tend to be followed by a larger number of traders. How to draw support and resistance, analysts, as well as traders, calculate pivots, major support and resistance levels for multiple time periods. These can be as short as an hour or as long as a month.
Calculation of Pivot Levels
The pivot level is derived by calculating the average of the high, low and closing prices for a time interval, that is:
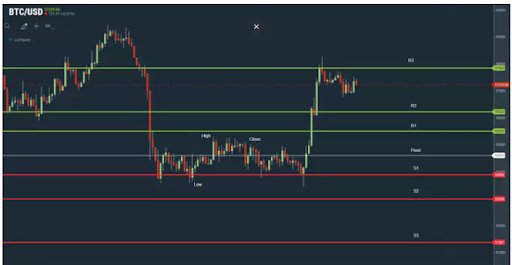
Looking at the 1-hour timeframe for the chart below, we take the average of the daily high of $55,329, the daily low of $53,711 and the closing price of $54,791 to get the next day’s pivot level. Here the pivot level would be $54,610.
Calculation of Support Levels
Once you calculate the pivot level, the main support levels which are S1, S2 and S3 can be calculated. In the example below, the daily pivot and major support levels can be calculated using the hourly chart.
First major support level: 2 x Pivot / previous time interval high. In the example above, it would be (2 x $54,610) / $55,329 = $53,892.
Traders would look at the first major support level as the entry price.
Second major support level: S2 = Pivot – (Daily High – Daily Low).
In the example above, that would be $54,610 – ($55,329 – $53,711) = $52,992.
Traders would look at the second major support level as the entry price for an extended reversal.
Third major support level: S3 = S2 – (Daily High – Daily Low).
In the example above, that would be $52,992 – ($55,329 – $53,711) = $51,374.
Traders would look at the third major support level as the entry price in case of a market sell-off.

Calculation of Resistance Levels
Once you calculate the pivot level, the main resistance levels which are R1, R2 and R3 can also be calculated.
First main resistance level: R1: = 2 x Pivot / low level of the previous time interval. In the above example, this would be (2 x $54,610) / $53,711 = $55,510.
Traders would look at the first major resistance level as the exit price.
Second Major Resistance Level: R2 = Pivot + (Daily High – Daily Low).
In the example above, that would be $54,610 + ($55,329 – $53,711) = $56,228.
Traders would look at the second major resistance level as the entry price for an extended rally.
Third major resistance level: R3 = R2 + (Daily High – Daily Low).
In the example above, that would be $56,228 – ($55,329 – $53,711) = $57,846.
Traders would look at the third major resistance level as the exit price for an event-driven breakout.
Support and Resistance Trading Strategies
As already outlined, traders can use major support and resistance levels for a number of time periods. It is therefore important to decide on trading strategies and then choose appropriate time periods for calculating pivots and major support and resistance levels.
For example, day traders would use 1-minute charts and the previous day’s high, low and close to calculate support and resistance levels for the following day.
In contrast, swing traders would use the 4-hour and daily charts to calculate the appropriate pivot level, major support and resistance.
Pivot and Support levels
When considering major support levels, major levels play a role in whether support levels are likely to come into play. There are two ways to consider pivot levels:
In order for the support levels to come into play, a pivot level drop would be required. This tends to be the scenario in a post-bullish or bullish session.
The inability to go over or back through the pivot level would also bring support levels into play. This tends to be the scenario in a post-bearish or bearish session.
Pivot and Resistance levels
When considering major resistance levels, pivot levels play a role in whether the resistance levels are likely to come into play. There are two ways to consider pivot levels:
A move through the pivot level would be necessary to bring resistance levels into play. This tends to be the scenario in a post-bearish or bearish session.
Avoiding falling through or back through a pin level would also bring levels of resistance into play. This tends to be the scenario in a post-bullish or bullish session.
Using Support Levels
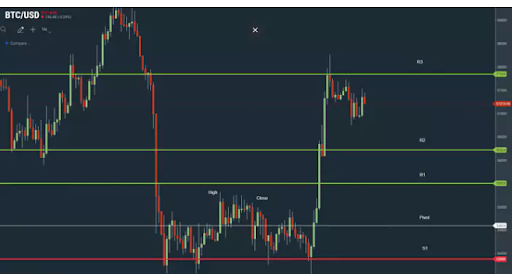
In a correction market, the asset may fall through its first support level, denoted as S1. Once broken, the second major support level will be the next key entry point for investors. In that case, S1 would become the resistance level.
The 3rd main level of support is generally breached only on a significant economic or financial event. These include earnings, central banks, government policies, and other global events.
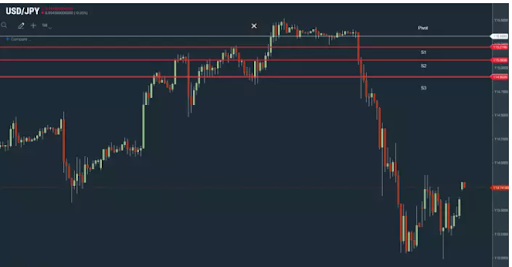
The chart below shows the flight to safety in response to the new Omicron strain of COVID-19. Demand for the Japanese Yen broke support levels as the dollar fell below 114 Yen.
Historically, Global Events Would Include:
- Global financial crisis.
- The covid19 pandemic.
- Dot.com
Here, the 1st and 2nd major support levels would provide little interest to investors looking to enter the market.
However, 3rd major support levels may have attracted investors. The key to using major support levels is to ensure that the asset price does not fall below an extended period of time.
Using resistance levels
In a bull market, the asset may pass through its first major resistance level, denoted as R1. Once broken, the second major resistance level will be the next key entry point for investors. In that case, R1 would become the support level.
The 3rd major resistance level is generally broken only as a result of a major economic or financial event. These include earnings, the central bank, government policies, and other global events.
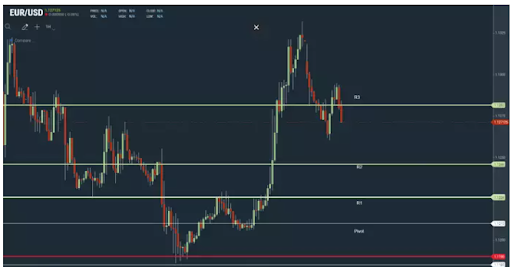
As in the example above, news of a new strain of COVID-19 and government plans to contain the spread led to the cancellation of EUR carry trades. The EUR broke 3 major resistance levels on its way to the $1.13 level against the dollar.
Historically, global events would include:
- Recovery after the COVID-19 pandemic.
- Recovery after the global financial crisis.
- Central bank action.
- US presidential election
In the case of stocks, corporate actions and earnings.
Here, the 1st and 2nd major resistance levels would provide little interest to investors looking to exit the market.
However, the 3rd major resistance level could have resulted in investors locking in profits. The key to using major resistance levels is to keep the asset price from moving above a set price for an extended period of time…
However, once the resistance level is broken, the resistance level becomes a support level that forms part of the major support levels for the time period.
Other major support and resistance levels
There are several indicators/strategies that traders and analysts must take into account when using the pivot levels and major support and resistance levels described above.
Of particular importance are historical highs, lows and daily, weekly, monthly and yearly highs and lows.
For example, an asset class may face resistance at its current weekly high, which may sit below the first major resistance levels.
Other strategies include using Fibonacci, moving averages, Bollinger and MACD.
Trading without using support and resistance levels would likely result in losses. However, more significant losses are likely without a trading strategy. The important thing is that both will need to be reconciled.
Please find the list of authentic Unocoin accounts for all your queries below:
- YouTube Channel: https://www.youtube.com/c/Unocoin/videos
- Newsletter: https://medium.com/subscribe/@Unocoin_growth
- Blogs: https://blog.unocoin.com
- Instagram: https://www.instagram.com/unocoin/
- Twitter: https://twitter.com/Unocoin
- Facebook: https://www.facebook.com/unocoin/
- LinkedIn: https://in.linkedin.com/company/unocoin
- Telegram Group: https://t.me/Unocoin_Group
- Telegram Channel: https://t.me/+fasQhTKBsfA5N2Zl
- Telegram: https://t.me/UnocoinSupport_Bot
- E-mail id: [email protected]
- Contact details: 7788978910 (09:30 AM IST – 06:30 PM, Mon – Sat)
- App store link: https://apps.apple.com/us/app/unocoin/id1030422972?ls=1
- Playstore link: https://play.google.com/store/apps/details?id=com.unocoin.unocoinwallet
Disclaimer: Crypto products are unregulated as of this date in India. They could be highly volatile. At Unocoin, we understand that there is a need to protect consumer interests as this form of trading and investment has risks that consumers may not be aware of. To ensure that consumers who deal in crypto products are not misled, they are advised to DYOR (Do Your Own Research).


 : Price Predictions & More")